Mapping Player Workload Burdens from Congested Fixture Lists to Predict Performance Dips in Multi Leg Wagers
Written by Yara Albrecht · May 16, 2026
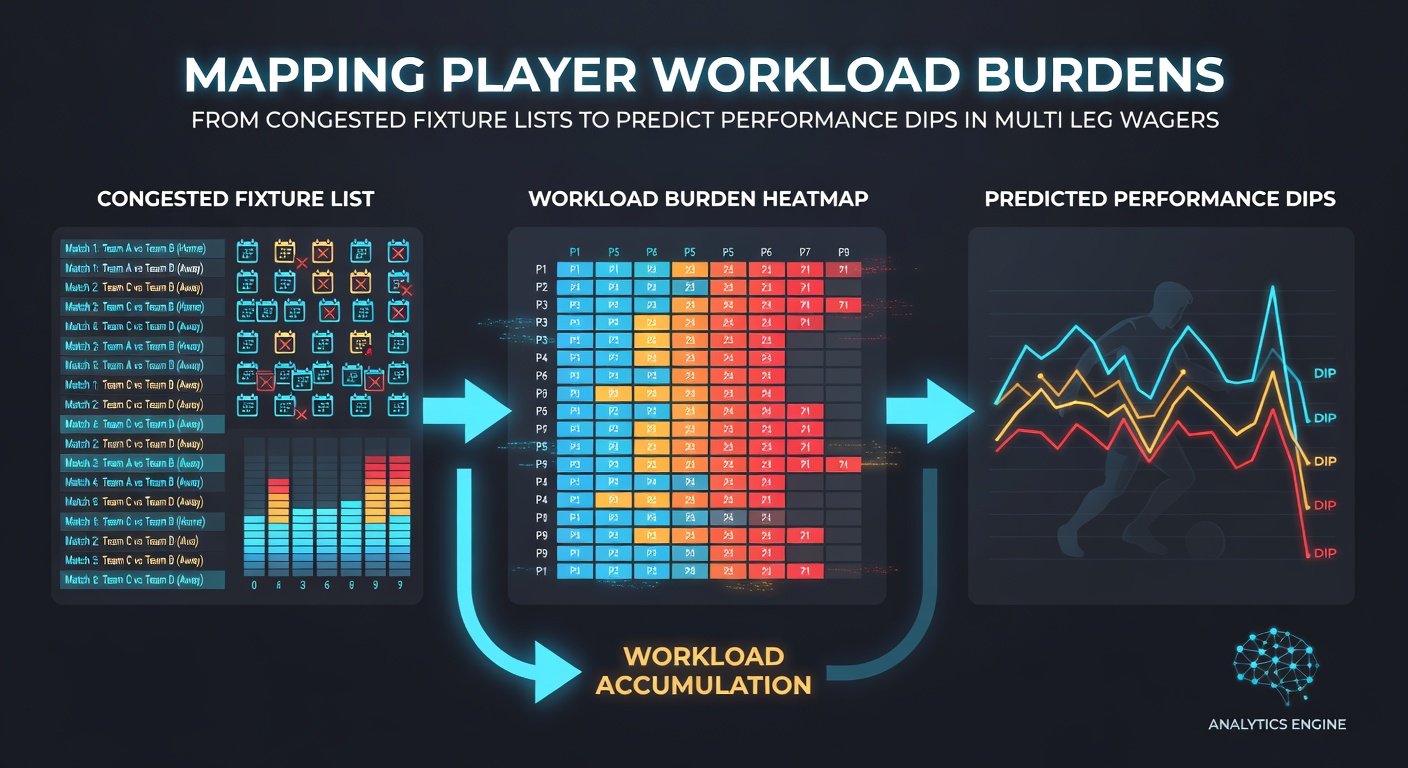
Mapping Player Workload Burdens from Congested Fixture Lists to Predict Performance Dips in Multi Leg Wagers
Fixture congestion creates measurable strains on players across professional soccer leagues, and bettors who track these patterns gain clearer signals for multi-leg wagers. Analysts compile data on minutes played, travel distances, and recovery windows to build models that flag probable output drops. Researchers at sports science institutes have documented how sequences of three matches in eight days correlate with reduced high-intensity running and lower pass completion rates in the subsequent fixture.
Quantifying Workload Through Modern Tracking Systems
Clubs now deploy GPS devices and heart-rate monitors that record every sprint, acceleration, and deceleration during training and matches. These systems generate workload scores based on distance covered above 25 kilometers per hour plus the number of explosive efforts. When a player exceeds a threshold of 30 percent above their seasonal average across a seven-day window, performance metrics tend to decline in the next outing. One study of elite European squads revealed that players logging more than 350 minutes over a ten-day period show a 12 percent drop in expected goals contribution during the following match.
Linking Congested Calendars to Observable Output Declines
League schedules pack fixtures around international breaks and cup replays, leaving limited recovery time. Data indicates that midfielders and full-backs suffer the steepest reductions in distance covered after back-to-back 90-minute appearances. Goalkeepers experience smaller but measurable effects on distribution accuracy when their teams play four matches in 14 days. Bettors constructing multi-leg accumulators therefore cross-reference fixture density with individual player profiles rather than relying solely on team form.
Building Predictive Models for Accumulator Selections
Statistical platforms combine fixture congestion indices with historical performance data to generate probability adjustments. A player appearing in four consecutive matches without a rest day receives an automatic downgrade in projected rating for the fifth fixture. These adjustments flow directly into expected-value calculations for legs involving player props or team totals. Observers note that teams with three or more players above workload thresholds concede 0.4 more goals per game on average during the congested stretch.
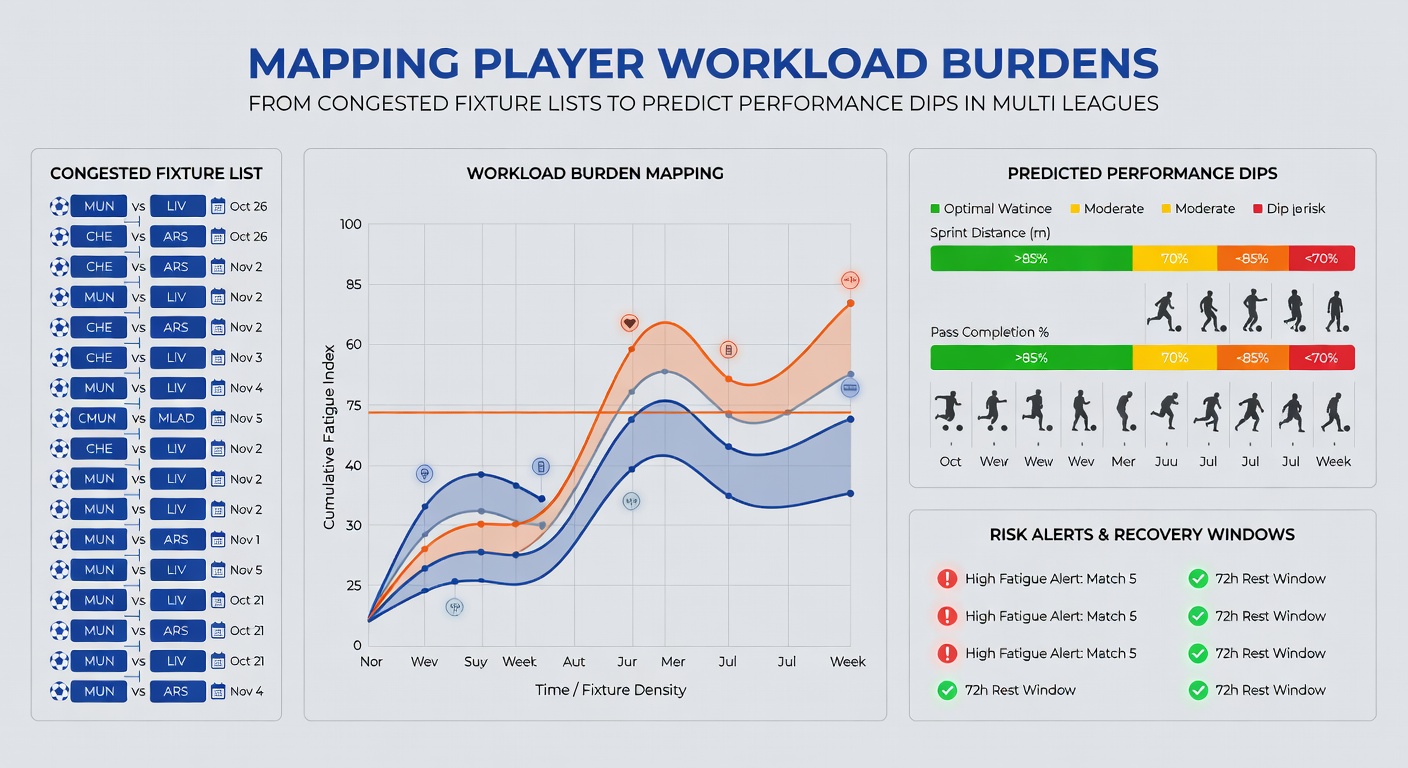
What's interesting is that recovery metrics such as creatine kinase levels and sleep duration further refine the model. When clubs schedule flights exceeding three hours between matches, the workload burden rises sharply. Analysts incorporate these variables into spreadsheets that output adjusted probabilities for each leg of an accumulator. The resulting selections avoid overexposure to fatigued athletes during peak congestion periods such as the December holiday schedule or the final weeks of May 2026.
Case Examples from Recent Seasons
During the 2024-25 campaign, one top-flight side played six matches in 18 days across three competitions. Tracking data showed a 15 percent reduction in sprint distance for their starting central defenders in the sixth fixture. Accumulator bettors who removed those defenders from clean-sheet legs recorded higher strike rates than those who followed pre-congestion trends. Similar patterns emerged in domestic cup replays where squad rotation proved insufficient to offset accumulated fatigue.
Integrating Workload Data into Multi-Leg Construction
Bettors begin by listing every player with elevated workload scores for the upcoming round. They then compare these names against historical decline rates in comparable fixture sequences. Legs involving player assists, shots on target, or team over/under totals receive revised probabilities before inclusion in the accumulator. This process repeats across multiple leagues to identify the cleanest combination of selections.