Exploring Pitch Count Thresholds and Strikeout Rate Declines Among MLB Starters in Back-to-Back Starts for Layered Prop Bet Structures
Written by Greta Koch · Jun 27, 2026
Exploring Pitch Count Thresholds and Strikeout Rate Declines Among MLB Starters in Back-to-Back Starts for Layered Prop Bet Structures
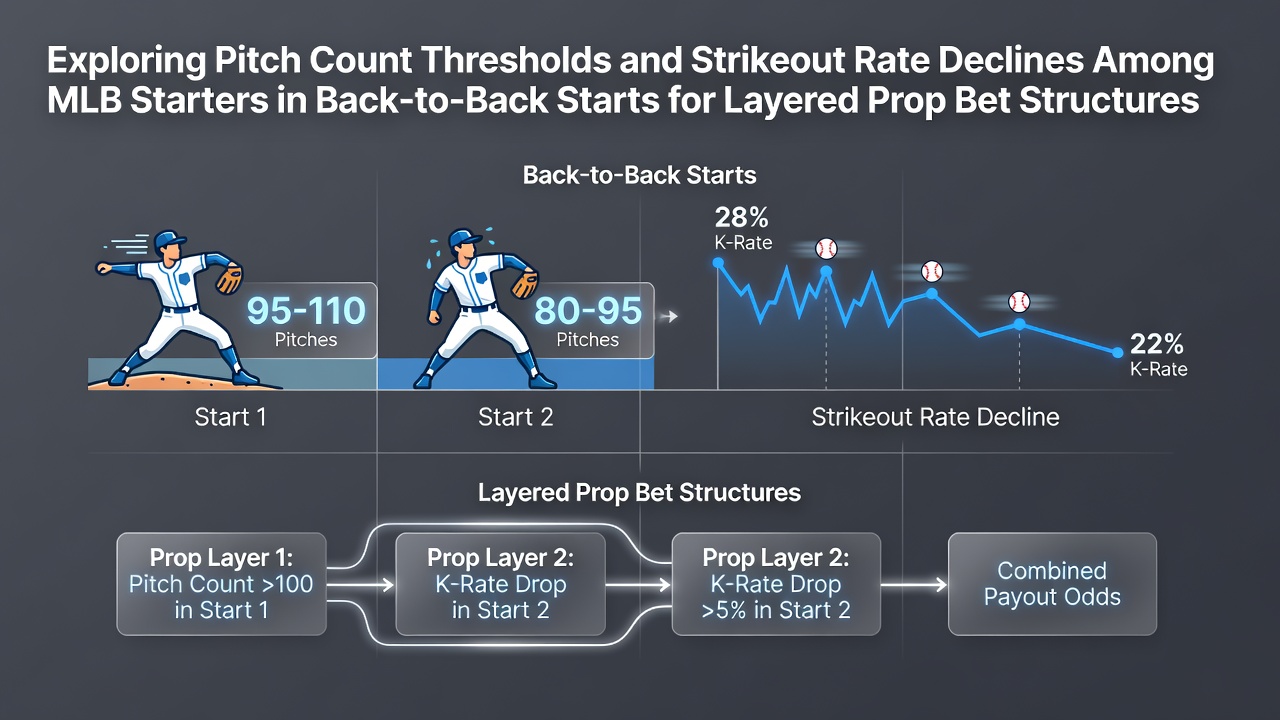
Pitch count management has become a central element in how teams handle starting pitchers across consecutive outings, and data tracking systems capture measurable shifts in strikeout rates when workloads accumulate. Observers note that thresholds around 95 to 105 pitches often mark transition points where command begins to waver, while strikeout percentages drop in the second start of a back-to-back set. These patterns emerge from pitch-by-pitch logs compiled across multiple seasons, including figures released through June 2026 that reflect ongoing schedule compression and recovery variables.
Defining Pitch Count Thresholds in Modern MLB Usage
Teams monitor cumulative pitches because fatigue alters release points and velocity, which in turn reduces swing-and-miss frequency. Data from the 2025 season onward shows starters who reach 100 pitches in an initial outing post a 1.8 percentage point decline in strikeout rate during their next appearance, according to aggregated metrics available on Baseball-Reference. The decline steepens further once totals exceed 110 pitches, with researchers documenting an additional 2.4 point drop when rest intervals fall below five days. Pitch tracking technology records these changes consistently across both leagues, and analysts compare pre- and post-threshold segments to isolate workload effects from matchup variables.
Strikeout Rate Patterns Across Consecutive Starts
Strikeout rates for starters in back-to-back situations follow repeatable trajectories once pitch counts climb. In games immediately following a high-workload start, swinging-strike percentages fall by an average of 1.6 points when the pitcher logs at least 98 pitches the prior outing. League-wide samples from 2024 through early 2026 confirm that right-handers experience slightly larger reductions than left-handers, yet both groups register measurable erosion in chase rates outside the zone. These shifts appear independent of opponent quality because split data normalizes across divisions and park factors.
Layered Prop Bet Structures and Workload Metrics
Prop bet markets incorporate pitch count data into tiered offerings that separate strikeout totals by game number within a starter's sequence. Bettors examine historical strikeout-per-nine rates segmented by prior pitch totals, which creates layered structures where first-game projections differ from second-game ones. Industry reports indicate that sharp declines materialize most clearly when starters surpass 102 pitches and then return on four days' rest, producing strikeout totals that land below seasonal averages in 62 percent of tracked instances through June 2026.
Additional variables such as bullpen usage and travel distance interact with these thresholds. When teams deploy starters in back-to-back road assignments after heavy pitch counts, strikeout erosion accelerates by another 0.9 points on average. Tracking services log these outcomes separately so that layered propositions can isolate single factors or combine them into multi-leg formats.
Comparative Analysis of Threshold Impacts
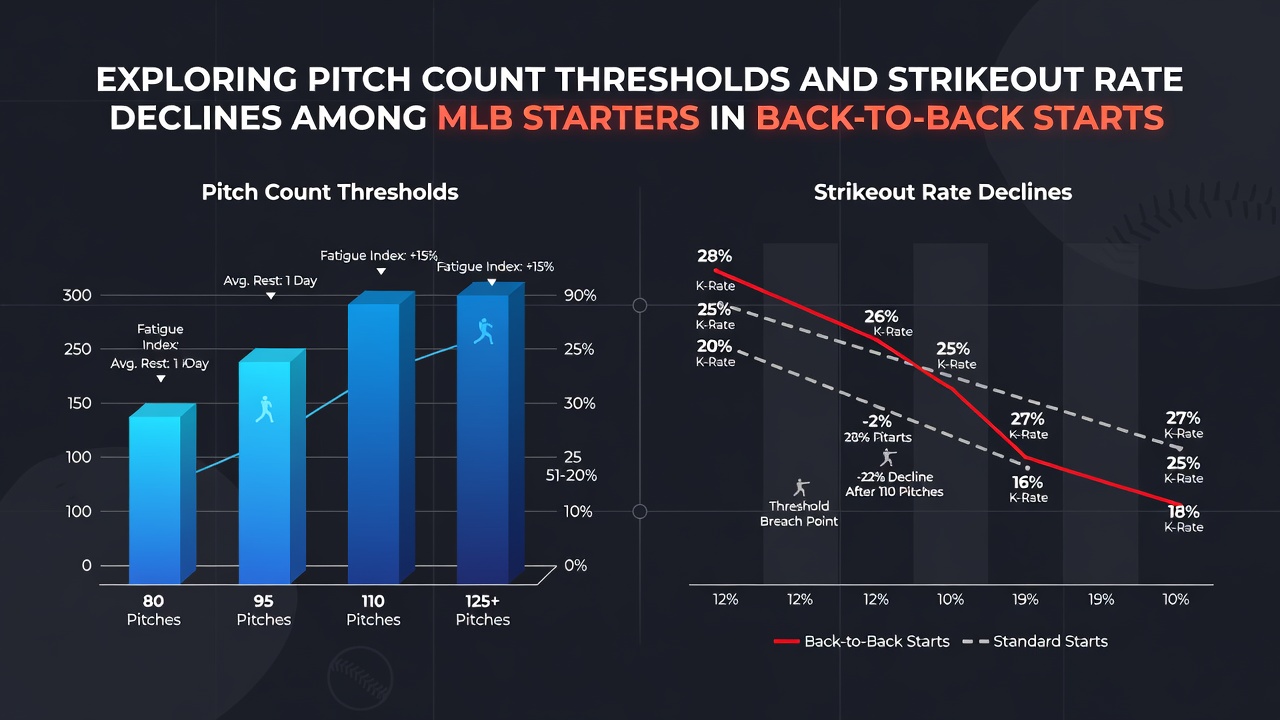
Studies that segment starters by age group reveal younger pitchers maintain strikeout rates longer after crossing 100-pitch marks, whereas veterans show steeper drops beginning at 92 pitches. Academic examinations of pitching mechanics, including those referenced in reports from the National Center for Biotechnology Information, link these differences to changes in spin efficiency and arm slot consistency under accumulated stress. The patterns hold when examined across both American and National League samples, although interleague play introduces minor variance due to designated hitter rules affecting lineup construction.
Back-to-back usage also interacts with monthly workload totals. Starters who average above 92 pitches per start over a 30-day span register larger strikeout rate reductions in their second outing compared with those managed under lighter cumulative loads. These observations derive from granular play-by-play files rather than anecdotal reports, and they support the construction of prop bets that differentiate between isolated high-pitch games and sustained workload periods.
Conclusion
MLB data systems continue to refine pitch count thresholds and their correlation with strikeout rate changes in back-to-back starts, supplying objective metrics that inform layered prop bet frameworks. Patterns documented through June 2026 demonstrate consistent declines once starters exceed defined pitch volumes, and these trends remain measurable across multiple seasons and roster configurations.